![[Translate to English:]](/media/_processed_/7/1/csm_IMG_7977_large_1defaf5de1.jpg "[Translate to English:]")

Project
Pinging Fishes – What goes around comes around
Adaptation and further development of methods for hydroacoustic estimation of fish stocks
In hydroacoustics, underwater sound waves and resulting echoes are used to study fish populations and marine habitats. By understanding the acoustic signatures of different organisms, it is possible to convert acoustic signals into biologically relevant quantities such as abundance or biomass.
Background and Objective
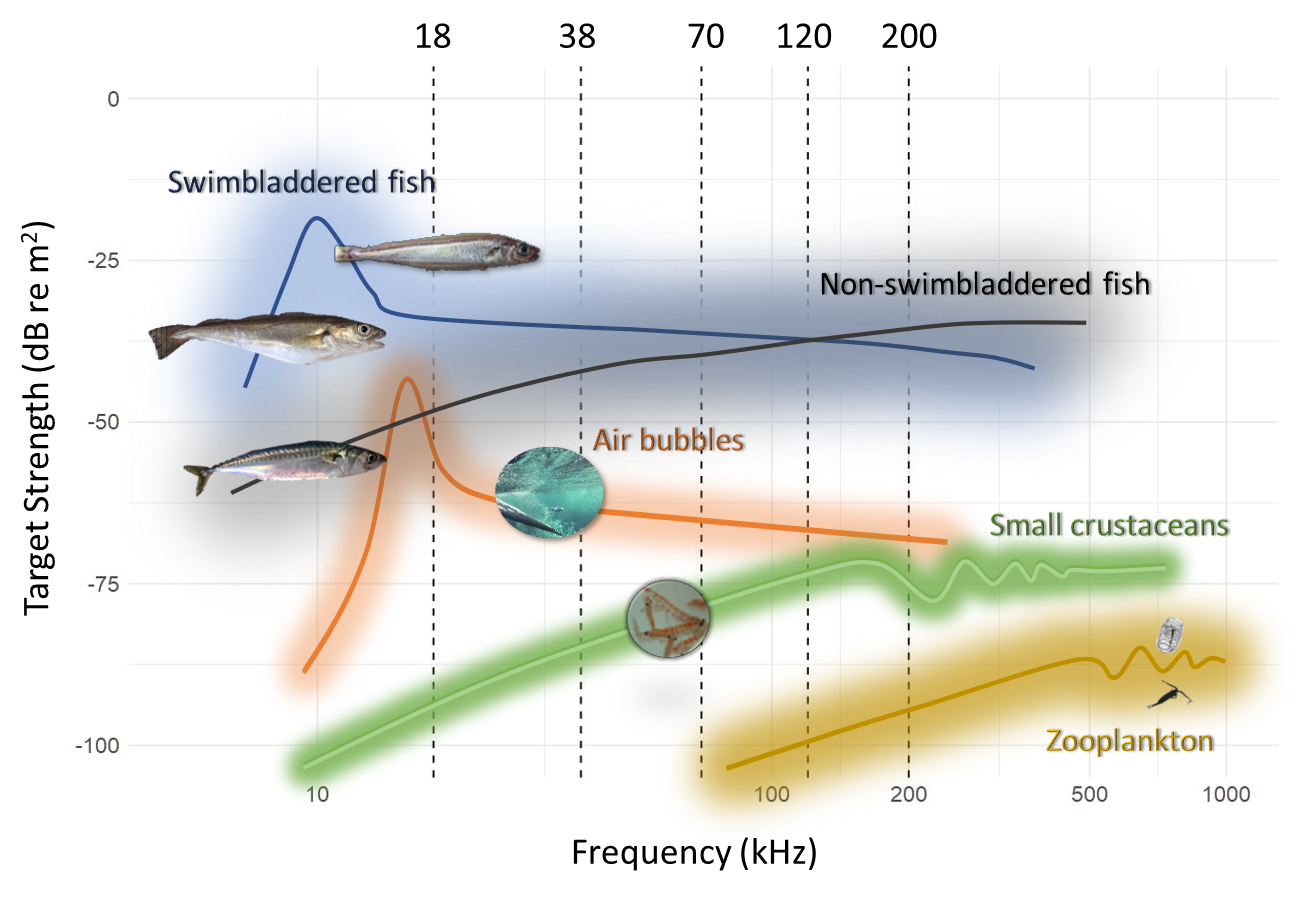
Any object or species with an internal density and/or internal sound velocity that differs from the density and sound velocity of the surrounding medium has a characteristic frequency-dependent acoustic signature, i.e. a characteristic "echo". This signature allows us to convert acoustic signals into parameters relevant to fisheries biology and ecology. The reflected sound energy (the echo) is compared with the emitted sound energy (from the sonar). With some limitations, the observed differences can then be used to draw conclusions about species and size composition. For example, a herring with a full swim bladder will reflect significantly more sound energy than a mackerel without a swim bladder. It is important to note that the density of the gas in the swim bladder differs greatly from the density of the surrounding medium (seawater), whereas the difference in density between the muscles and skeleton of a mackerel is much smaller compared to the surrounding medium. The speed of sound also varies greatly: in air it is about 300 m/s, which is very slow compared to seawater at about 1,500 m/s or the average speed of sound in the tissue/body of a mackerel at about 1,535 m/s.
Target Group
Policy-makers in marine environmental as well as common fisheries policy; Fisheries scientists; interested public
Approach
The project is based on hydroacoustic data collected during our standard surveys, other research expeditions, or through deploying stationary equipment (in fish tanks, etc.). The echo signature of different organisms depends not only on their internal sound speed/density, but also on their behaviour and shape, and the frequency of the sound signals emitted by the echosounder. To characterise this signature, we use both scientific multi-frequency echosounders and broadband echosounders, to cover a wide range of frequencies. We also use various physical, analytical and numerical modelling approaches to better understand the collected sound signals and to better describe the characteristic echo signatures.
The characteristic echo signature of various fish species and other marine organisms includes their target strength. Target strength is a key parameter we determine for the acoustic characterisation of organisms.
Data and Methods
We collect data using state of the art scientific echosounders and broadband echosounders with different operating frequencies. This makes it possible to determine the 'echo signature' of different types of marine organisms using their frequency-dependent target strength over a broad frequency spectrum.
The target strength (TS) is the acoustic fingerprint of these species. It can be determined in a number of ways.
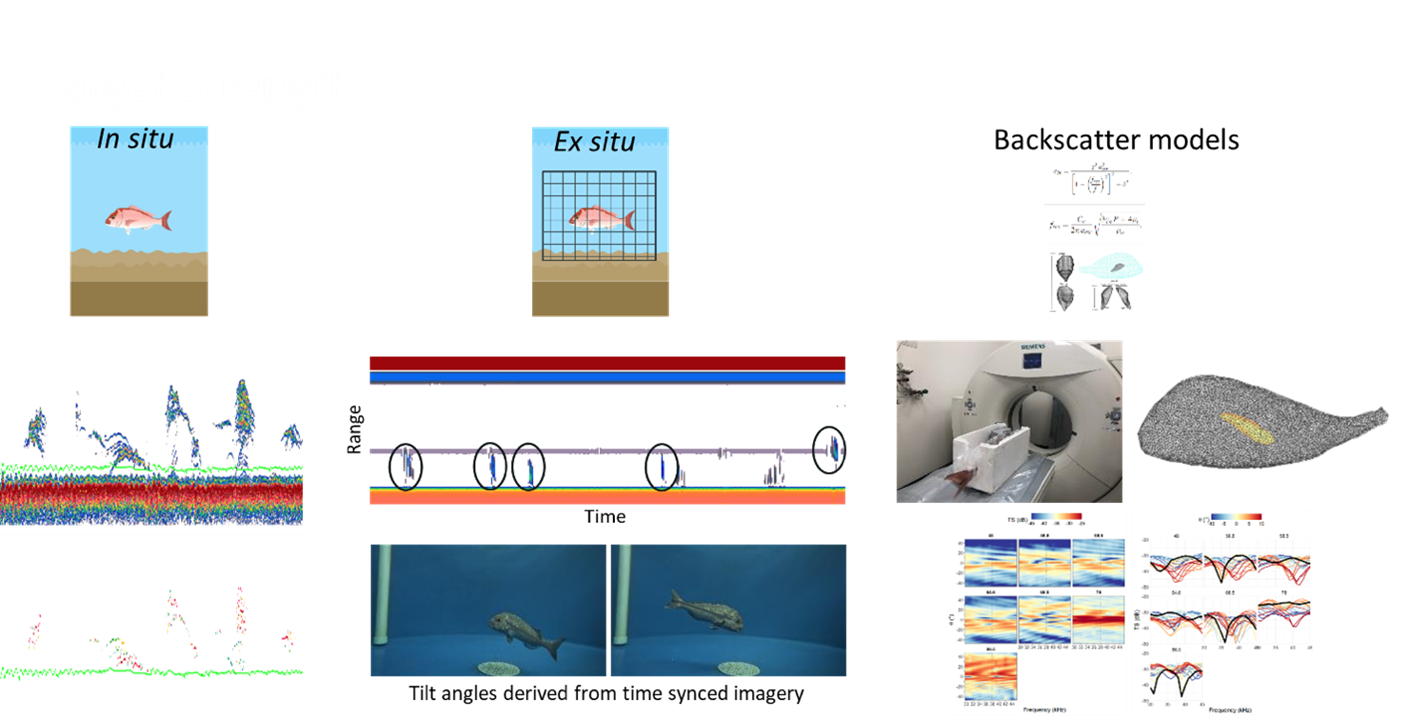
- Field measurements
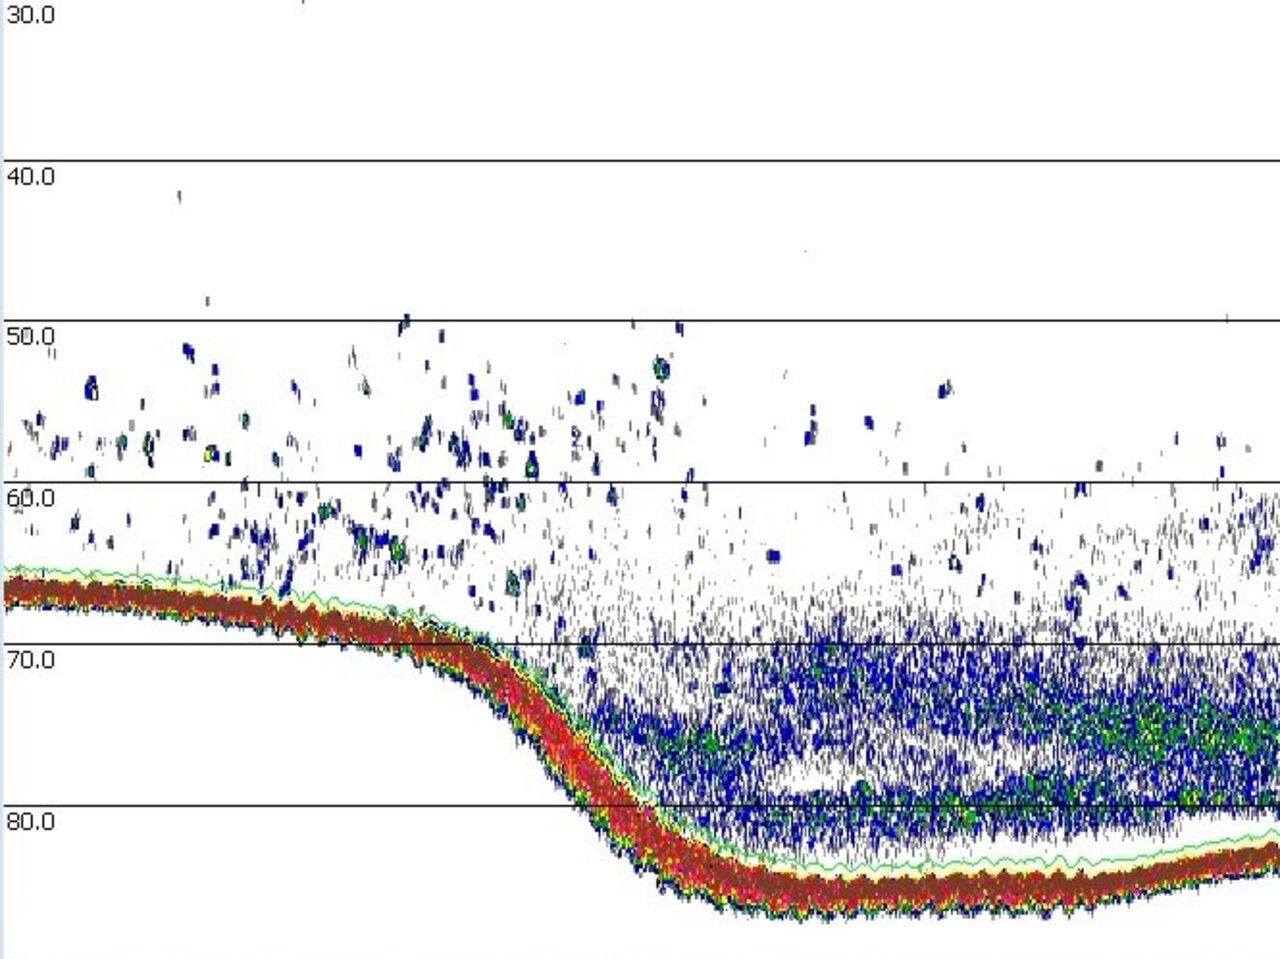
Ideally, the species for which the target strength (TS) is to be measured should be found in a not very dense (monospecific) school or as a single individual. This allows the echoes of individual fish to be clearly identified and acoustically separated from each other. In addition, targeted, representative net catches or synoptic optical data (stereo cameras, etc.) provide good biological validation information on the length distribution in a school or of individual fish. These so-called in situ measurements of TS are ideal because they best represent the reality in the field. However, these data cannot be collected for many species because the schools are too dense to extract signals from individual fish, or because the schools are composed of different species. It is also often impossible to collect good biological data that are relevant and of sufficient precision to determine target strength (TS).
- Experimental evaluation
Alternatively, controlled experiments can be used to determine target strength (TS). This can usually be done either in aquariums or in the field using net cages or similar devices. In principle it is a targeted and controlled recording of the echo signature of the ‘captured’ fish or other marine organisms. Ex situ experiments have the advantage that the size, age and sex of the individuals to be measured can be precisely determined. However, the temporary confinement of the animals for these measurements may prevent them from displaying their natural behaviour (swimming position, swimming movements), which are parameters that influence the echo signature. The experiments can also be very time consuming and costly.
- Modelling approach
The theoretical target strength (TS) can be estimated using different modelling approaches. A general distinction is made between analytical, exact models (physically accurate, but only for simple shapes), approximate models (mathematically simpler, for more complex shapes, limited framework conditions) and numerical models (computational, complex structures, very good approximation to reality).
Our Research Questions
How can we use acoustic signatures to better classify acoustic data into species and length groups?
How can data from modern fishing echosounders help to improve hydroacoustic stock estimates and minimise the invasive nature of sampling?
Preliminary Results
- Publications in international scientific journals
- Presentations and working group documents within the context of various ICES working groups (e.g. ICES WGFAST, ICES WGIPS etc.)
- Development of R packages for modelling acoustic signatures
- Weakly scattering, fluid-like marine organisms (primarily zooplankton) - Distorted Wave Born Approximation
- Weakly or strongly scattering species (primarily fish) – Kirchhoff-Ray Mode
- Calculation of errors and uncertainties in current surveys
Researchers at the Thünen Institute, in collaboration with colleagues from the ICES Working Group on International Pelagic Surveys (WGIPS), have developed geostatistical methods to more accurately calculate the uncertainties of past surveys, using the North Sea HERing Acoustic Survey (HERAS) as an example. Simulating many surveys allows researchers to determine the uncertainty in the results of previous, historical surveys as accurately as possible. This allows improved planning and interpretation of previous results. Preliminary results were also presented at the ICES Small Pelagic Fish 2022 International Symposium in Lisbon.
Links and Downloads
- International Council for the Exploration of the Sea (ICES)
- ICES Working Group on International Pelagic Surveys (WGIPS)
- ICES Working Group on Fisheries Acoustics, Science and Technology (WGFAST)
Thünen-Contact

Involved Thünen-Partners
Duration
1.2001 - 12.2027
More Information
Project status:
ongoing
Publications
- 0
Duranson M, Berline L, Guilloux L, Della Penna A, Ohman MD, Gastauer S, Cotté C, Banaru D, Garcia T, Berta M, Doglioli AM, Grégori G, d'Ovidio F, Carlotti F (2026) The North Balearic Front as an ecological boundary : zooplankton fine-scale distribution patterns in late spring. Biogeosciences 23(1):363-385, DOI:10.5194/bg-23-363-2026
- 1
Palermino A, Gastauer S, De Felice A, Canduci G, Biagiotti I, Leonori I (2025) Characterization of European sprat acoustic backscatter through modeling techniques : a comparison with in situ observations in the Mediterranean Sea. Fish Res 283:107298, DOI:10.1016/j.fishres.2025.107298
- 2
Gastauer S, Ohman MD (2025) Resolving abrupt frontal gradients in zooplankton community composition and marine snow fields with an autonomous Zooglider. Limnol Oceanogr 70(S1):S102-S120, DOI:10.1002/lno.12642
- 3
Scoulding B, Fairclough DV, Devine C, Jackson G, Lewis P, Waltirck D, West L, Skepper C, Briggs J, Lek E, Yeoh D, Crisafulli BM, Fisher E, Denham A, Mitchell P, Gastauer S (2024) Aerial drones and recreational fish finders: evaluating a low-cost method for surveying fish aggregations. Mar Freshwater Res 75(18):MF24207, DOI:10.1071/MF24207
- 4
Van Dijk TAGP, Roche M, Lurton X, Fezzani R, Simmons SM, Gastauer S, Fietzek P, Mesdag C, Berger L, Klein Breteler M, Parsons DR (2024) Bottom and suspended sediment backscatter measurements in a flume - Towards quantitative bed and water column properties. J Mar Sci Eng 12(4):609, DOI:10.3390/jmse12040609
- 5
Lebourges-Dhaussy A, Ariza A, Diogoul N, Gastauer S, Handegard NO, Jech M, Khodabandeloo B, Bouffant N Le, Lee W-J, Macaulay G, Receveur A, Ryan T, Sakinan S, Schaber M, Stevens J, Sullivan P, Viehmann H, Wall C, Warren J, Wieczorek A, Zydlewski G (2023) Working Group of Fisheries Acoustics, Science and Technology (WGFAST). Copenhagen: ICES, iii, 11 p, ICES Sci Rep 5(90), DOI:10.17895/ices.pub.24190512
- 6
Jech M, Schaber M, Gastauer S, Alegria N, Algroy T, Andersen LN, Anderson C, Annasawmy AP, Arendt C, Ariza A, Barbin L, Berger L, Boyra G, Brehmer P, Bristow M, Calise L, Carlsen A, Cermak J, Chawarski J, Chu D, et al (2022) Working Group of Fisheries Acoustics, Science and Technology (WGFAST). Copenhagen: ICES, 93 p, ICES Sci Rep 4(54), DOI:10.17895/ices.pub.20178464
- 7
Jech M, Ariza A, De Robertis A, Rezvanifar A, Lavery AC, Lebourges-Dhaussy A, Sepulveda A, Bertrand A, Blanluet A, Scoulding B, Berges B, Bárðarson B, Robinson C, Wall C, Anderson C, Taylor C, O'Donnel C, Grados D, Copland D, Schaber M, et al (2020) Working Group on Fisheries Acoustics, Science and Technology (WGFAST). Copenhagen: ICES, 18 p, ICES Sci Rep 2(70), DOI:10.17895/ices.pub.7444
- 8
Gröhsler T, Schaber M (2014) Annex 6: Cruise reports from other acoustic surveys in the area : Annex 6a: Western Baltic acoustic survey ; Survey report for FRV "Solea" ; German Acoustic Autumn Survey (GERAS), 30 September 2013 - 19 October 2013. In: Report of the Working Group of International Pelagic Surveys (WGIPS) ; 20-24 January 2014. Copenhagen: ICES, pp 224-251
- 9
Gröhsler T, Schaber M (2014) Survey Report for FRV "Solea" German Acoustic Autumn Survey (GERAS) 30 September 2013 - 19 October 2013. In: Report of the Baltic International Fish Survey Working Group (WGBIFS) : 24-28 March 2014 ; Gdynia, Poland. Copenhagen: ICES, pp 250-258
- 10
Planque B, Kristinsson K, Astakhov A, Bernreuther M, Bethke E, Drevetnyak K, Nedreaas K, Reinert J, Rolskiy A, Sigurdsson T, Stransky C (2013) Monitoring beaked redfish (Sebastes mentella) in the North Atlantic, current challenges and future prospects. Aquatic Liv Res 26(4):293-306, doi:10.1051/alr/2013062
- 11
Schaber M, Gröhsler T (2013) Survey Report for FRV "Solea" 2-21 October 2012. In: Report of the Baltic International Fish Survey Working Group (WGBIFS) : Annex 8: Cruise reports of acoustic surveys BASS and BIAS in 2012. Copenhagen: ICES, pp 266-289
- 12
Bethke E, Götze E, Planque B (2010) Estimation of the catchability of redfish and blue whiting for survey trawls in the Norwegian Sea. J Appl Ichthyol 26:47-53, DOI:10.1111/j.1439-0426.2010.01446.x


