Expertise
The view from space
Stefan Erasmi | 27.12.2023
Detailed land use data is essential for many monitoring tasks at the Thünen Institute and forms an essential basis for research and advisory activities. However, the availability of such data is often limited. Remote sensing closes this gap.
The European Union pays billions to agriculture to make it more environmentally friendly. Fewer climate-damaging emissions, more carbon sequestration in soils or hedges, a greater contribution to biodiversity, less wind and water erosion - these and other environmental goals have become increasingly important in the past. In this situation, the question of whether the use of resources is worthwhile and how it should possibly be changed is becoming increasingly important.
Politicians, farmers, environmental groups and even audit offices are asking which measures will bring major environmental benefits and which may bring none at all. Another question: with what certainty can such assessments be made for the very different site conditions in the various regions of Germany?
This is where science comes in. There are a large number of studies that have analysed individual aspects of the relationship between agriculture and the environment at selected locations. What has been lacking to date are reliable nationwide analyses that cover the entire spectrum of locations and measures. For example, it has not yet been possible to say how crop rotations have developed in the various regions of Germany. Similarly, the proportions of intensively or extensively utilised grassland were not known. In the absence of such data, it is difficult to make reliable statements about changes in agricultural production systems and their potential environmental impacts.
Interaction of field data, satellite images and artificial intelligence
The European earth observation programme Copernicus, which has been in operation since 2014, is fundamentally changing the framework conditions as it provides a highly accurate, comprehensive and freely accessible wealth of data via its own satellite fleet (Sentinel satellites). The satellites are able to scan the entire land surface repeatedly within a few days using various sensors. On the one hand, optical scanners are used to record the reflected sunlight and, on the other, active systems that emit radar waves and "measure" the energy scattered back.
However, the measurement data generated in this way is not self-explanatory, so the satellite does not report "winter wheat" or "field margin" for a specific observation point. Rather, it is necessary to derive characteristics of agricultural land use from the spatial patterns and the temporal sequence of the information in the various spectral ranges. This can be achieved with machine learning and artificial intelligence.
Ground truthing plays an important role here: only if the calculation tools are fed with georeferenced information about the land use observed on the ground in addition to the satellite measurement data can they learn how to interpret the satellite information correctly. In this way, the gigantic "information mush" can be converted into spatially unambiguous and accurate information about the categories that are ultimately of interest (current agricultural use, management measures, field margins, etc.).
Land use as an indicator of habitat diversity
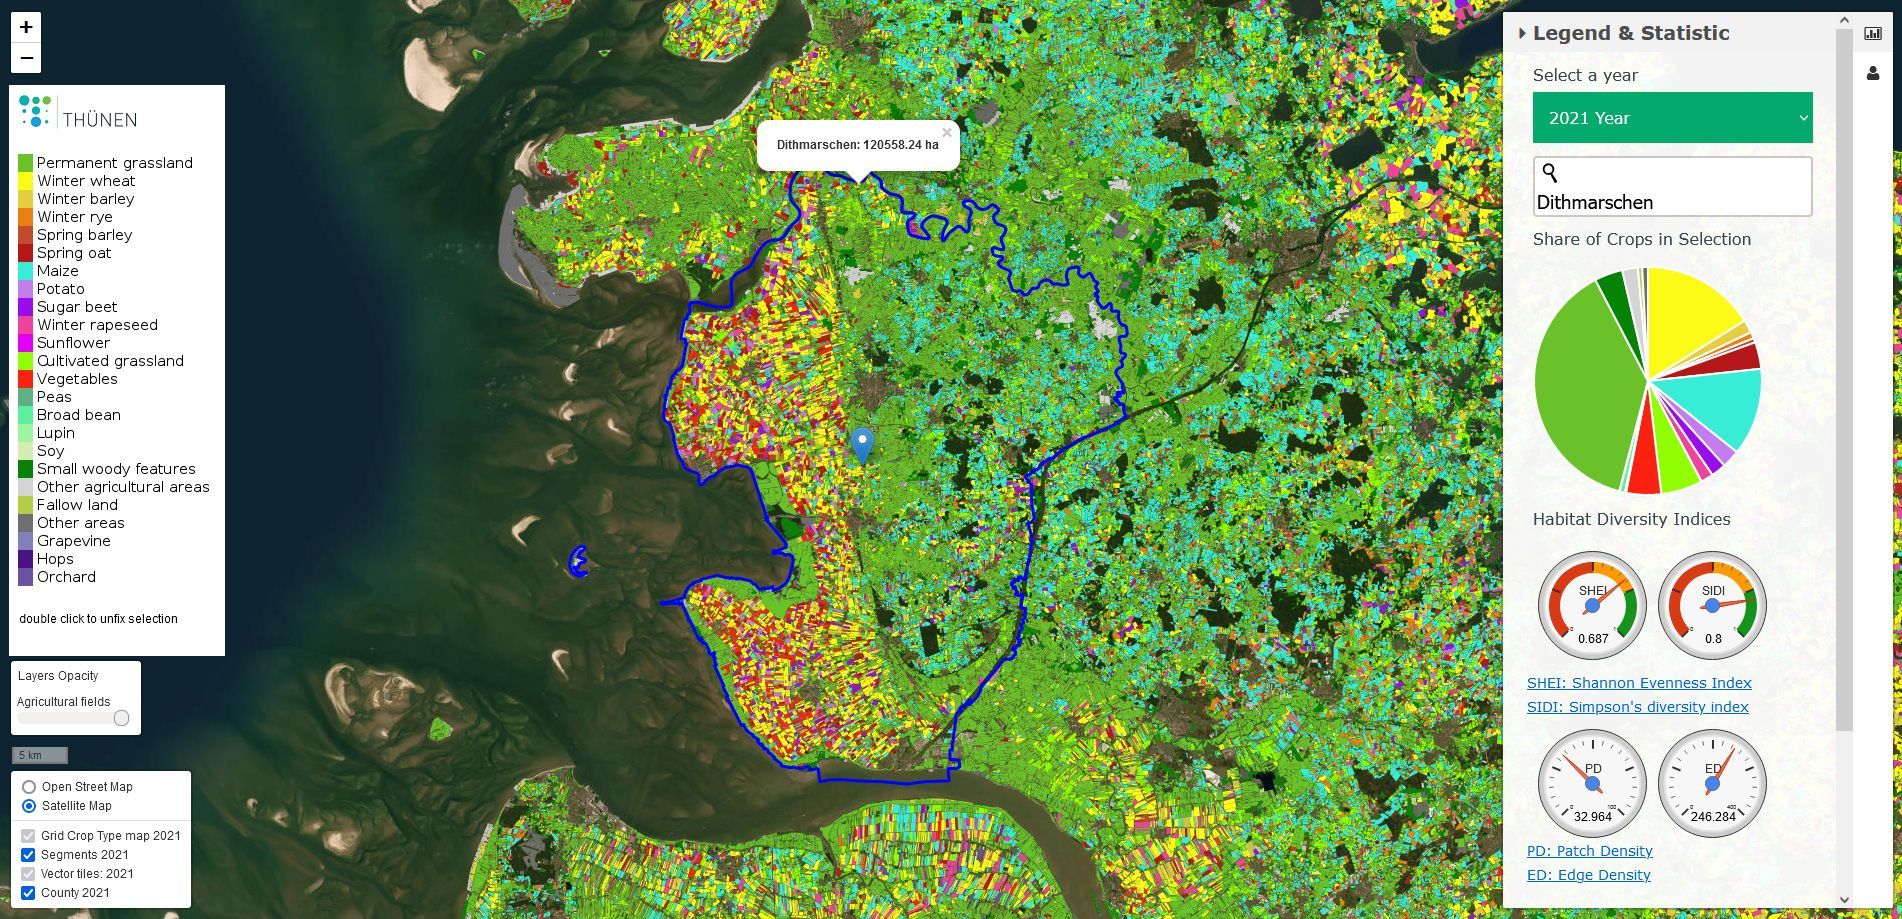
The working group Thünen Earth Observation (ThEO), which was established a few years ago, has developed these new technological possibilities for various fields of application. The "basic product" is annual maps of the main utilisation classes (main crop types, non-productive areas and grassland) for the entire open landscape in Germany. These maps are used, for example, for the joint project Monitoring biodiversity in agricultural landscapes (MonViA) to calculate indicators of land use diversity. The figure shows how such indicators can be visualised at different spatial reference levels. By analysing the main land use over several consecutive years, the cropping sequence (crop rotation) can be derived. From the point of view of agri-environmental policy, a multi-crop rotation is desirable because it has positive effects on both habitat quality and various protective functions of the soil. MonViA is now in a position to regularly report the cropping sequence as an indicator of land-use diversity in the agricultural landscape nationwide.
The full scientific power of the MonViA network will be realised when the land use data (e.g. crop succession) is combined with other geo-referenced information (e.g. from wild bee monitoring) in the future. It will then be possible to analyse the impact of land use development in the various natural areas on certain nature conservation policy targets and the repercussions this has on the productivity and resilience of agricultural production systems for the whole of Germany.
Data freely available
The range of applications for remote sensing data has now expanded further. In addition to analyses of biodiversity, the Thünen Institute also carries out analyses of the erosion risk of sites, the development of carbon stocks and greenhouse gas emissions as well as grassland intensity and biomass formation on grassland.
The data generated in such projects is made available to the public as far as the legal framework allows. To this end, the Thünen Remote Sensing Atlas was recently put into operation, which describes the data sets generated from satellite data and makes them explorable in the form of interactive map views. This atlas also contains data sets on forest condition, which are generated on the basis of satellite data at the Thünen Institute of Forest Ecosystems. Selected data sets can be downloaded free of charge under a CC-BY-4.0 licence and used for your own work.
Source:
- Wissenschaft erleben 2023/2The article on page 6/7 (in German)


