![[Translate to English:]](/media/_processed_/8/e/csm_Bildschirmfoto_2021-03-03_bearb_fc48ac88bf.jpeg "[Translate to English:]")
![[Translate to English:]](/media/_processed_/8/e/csm_Bildschirmfoto_2021-03-03_bearb_ba3ec0e9d7.jpeg "[Translate to English:]")
Project
Optimized sustainable pasture utilisation of the semi-arid savanna in the Kalahari with organic cattle and sheep farming?

Sustainable development of semi-arid grassland utilsation through optimised management of stock densities, recovery periods and carring capacity of organic cattle and sheep farming on the example of Springbockvley, Namibia
Grazing is still the most important utilisation of the vast semi-arid savannas of Afrika. This areas are endagered due to climate change and not sustainable herd management (degradation and desertification). With measures of organic farming and holostic management we try to increase the natural biomass production and therefore the production of meat in kg per hectare and year. This will result in better profitability and performance of grassland farming.
Background and Objective
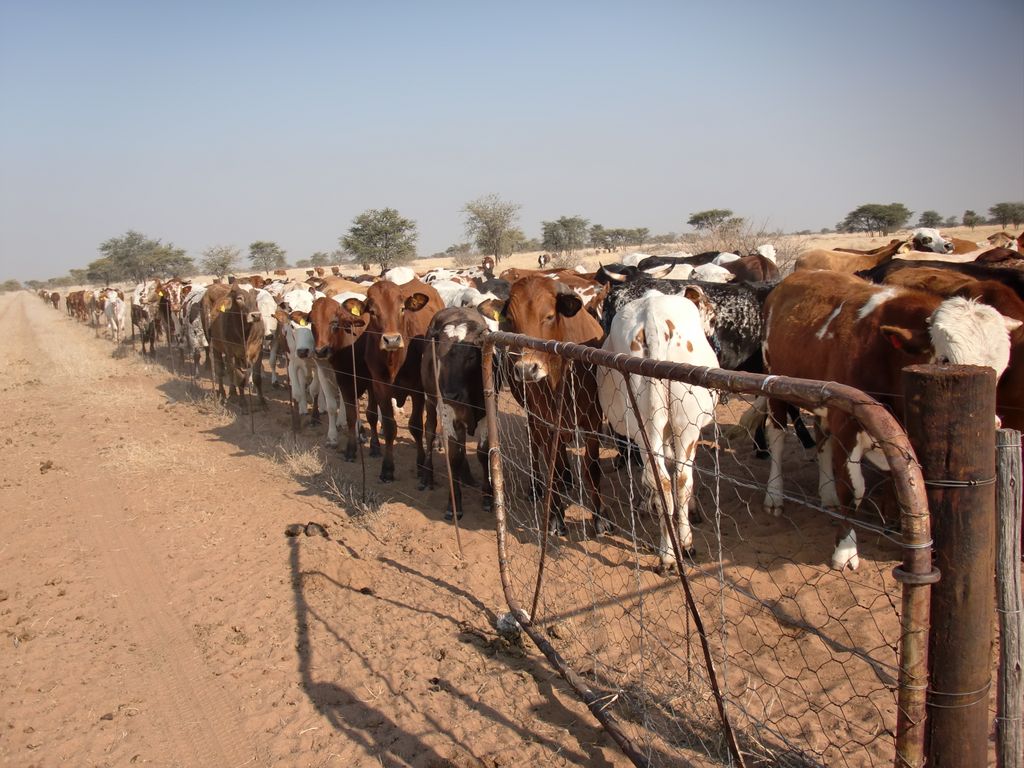
Livestock farming in the vast grazing areas in Namibia partly shows severe management deficiencies which results in desertification and degradation. Livestock is kept in fenced pastures on ranches, herded on communal farmland, or kept as free roaming or herded livestock at low stocking rates (10-20 ha / LU). A major problem for grassland productivity in savanna rangelands is the absence of recovery periods. Insufficient recovery periods lead to reduced productivity.
Inproved grazing systems with high stock densities do impact through trampling, defoliation of plants, and excretion, influence water and nutrient flux processes and parameters, and thus overall grassland productivity. This does result in more biomass and last but not least in higher meat productivity or less risk in the case of drought.
Questions for the research are:
- Which methodology is suitable to measure biomass production and grazing days?
- How does the changing of stock densities (LU / ha) and stocking rates (LU / ha / a) influence biomass production?
- How does the changing of the grazing management influence the productivity (kg meat / ha / a)?
- How does the changing herd management influence the livestock profitabiliy?
Approach
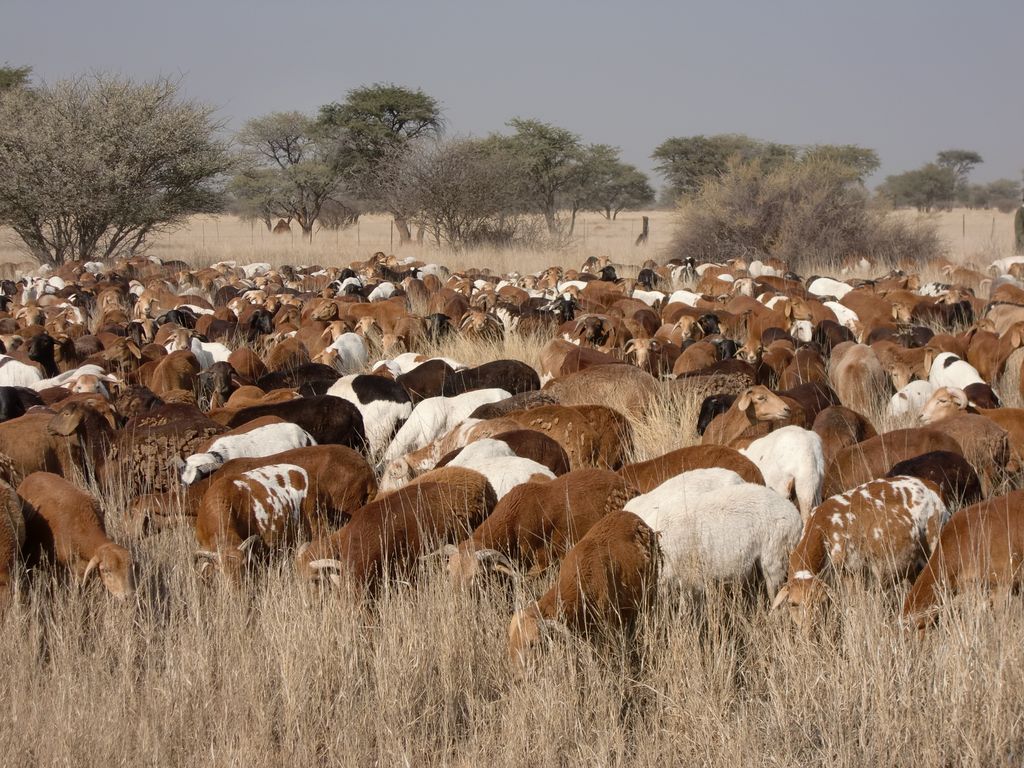
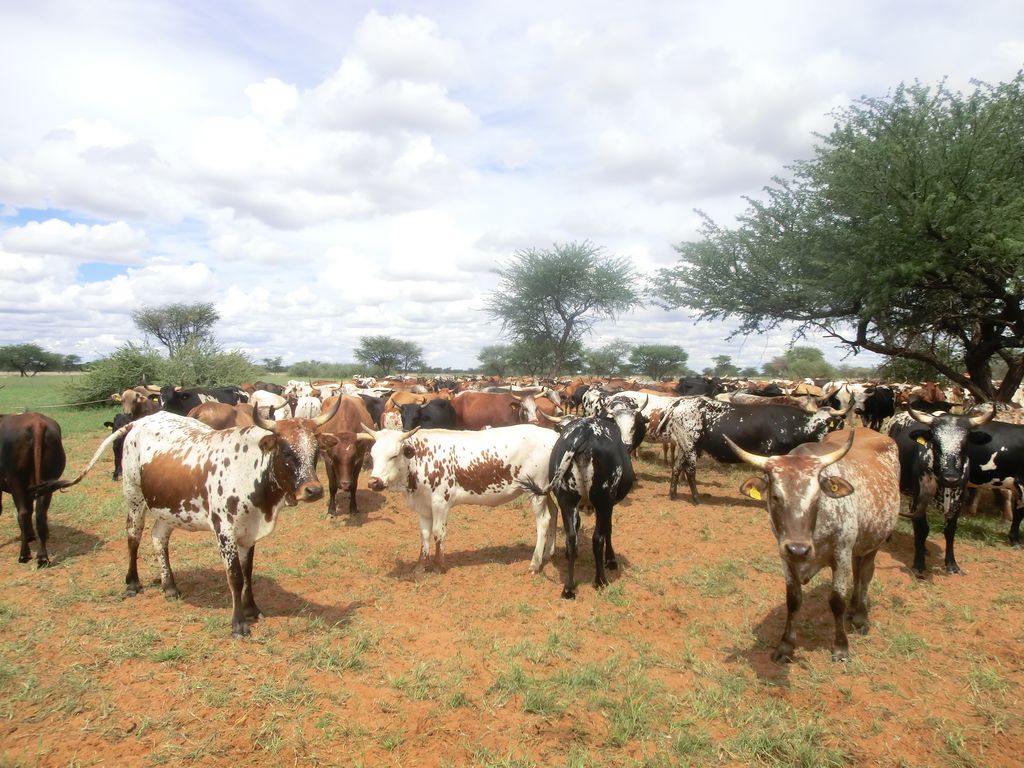
Different stocking densities and stocking rates of a 800 head cattle herd and 3,500 head sheep flock on the 9,500 ha rangeland farm Springbockvley in Namibian Organic will be taken as starting point to assess and develop sustainable stock densities and stocking rates on grassland in Namibia. The farm is managed according to the Holistic Management (HM) principles since 1990. All 3 herds will follow the „red grazing line“ on the farm and will give recovery/resting periods between 60 and 100 days. That means, that every herd/flock will have grazed every paddock approximately 1,3 times a year. The experiment will be carried out for 4 years (2014 – 2018).
For the project two variations will be integrated into the normal (control) grazing management:
- Increased stocking density (The paddock will be subdivided with a mobile electric fence into a number of parcels equivalent to the estimated grazing days. Every day a new parcel will be opened for the herd to graze.)
- Increased stocking rate (The paddock will be grazed for twice the duration of estimated grazing days.)
These variations will be compared with the current system of stock density and stocking rate. For these experiments, 4 replications have been selected on the farm. The goal of the research is to prove if these changes can be measured scientifically with several methodologies.
Data and Methods
A) Grazing management for experiments
The variation of the herd management will be done while the routine grazing modus, following the „red line“. There will be no fixing of the date, when the herds enter the paddock. The herds will enter each paddock in compliance with the grazing plan designed as per description above. The fodder availability expressed in grazing days per ha will be assessed in May of each year. The selected paddocks will be managed according to the grazing plan, and this will be assessed. The „red line“ has been modified so that the herds/flocks will always graze two normal paddocks (managed according to the current grazing regime) before they enter a treatment paddock (increased density or double stocking rate). This is deemed necessary as an adaptation period for the animals before entering treatment. The second of the normal paddocks between two treatments serves as control (cf. Table and map above).
B) Livestock assessment
- All cattle are weighed once every year during the compulsory vaccination routine (Anthrax, Brucella).
- The livestock is weighed always while they are close to the weigh scale (water point Mahali, 500 m east of farm house).
- All cattle will be weighed.
- A randomly selected group of sheep will be weighed: clustered by age and function (lambs <6 months; lambs 6-12 months; adult sheep > 1 year). The average number per group should be 50 animals. The result is assumed to be the average weight of all the other sheep in that respective same cluster. c. All cattle and sheep will be estimated in liveweight as soon as they enter the experimental paddocks to have the most accurate liveweight of the herds.
- The wild game will be assessed for the experimental paddocks (in estimated kg liveweight).
- All routinely gathered weight data of livestock (liveweight, carcass weight, birth weights) will be included in the data base to improve the data as much as possible.
- Births weights of calves and lambs will be recorded randomly (50 calves and 200 lambs per season).
- All livestock records will be included in the study: losses, sales and purchases, livestock diseases, treatments, calvings, etc. .
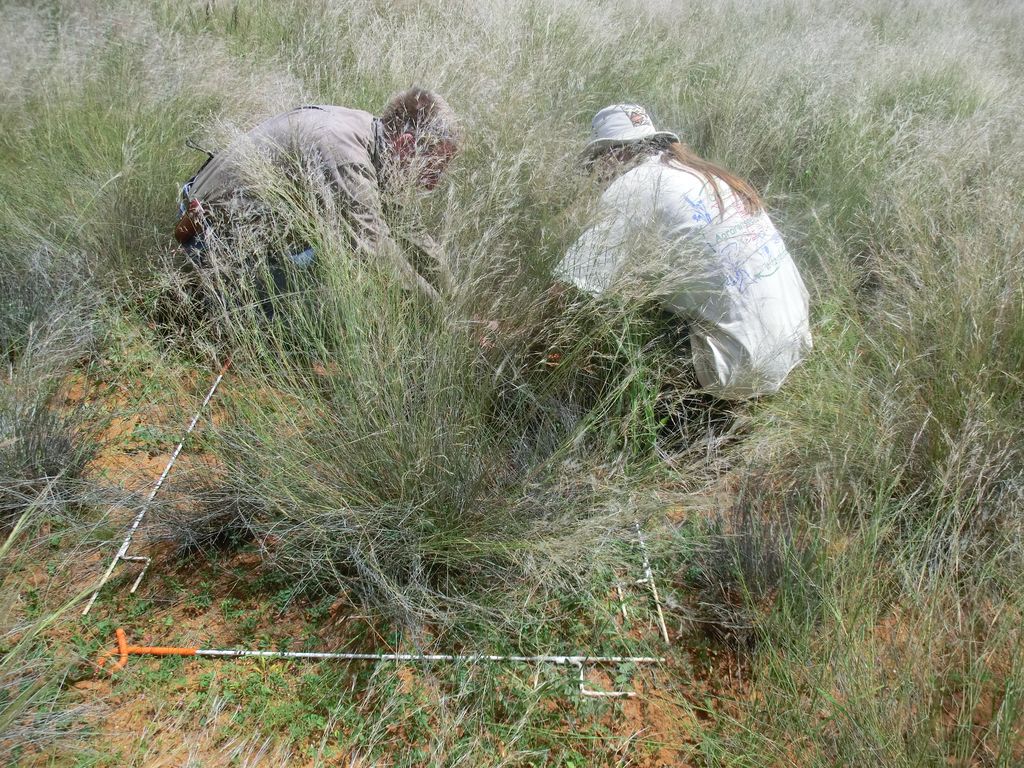
C) Vegetation assessment
The main proof of the herd management will be on the assessment of the vegetation. Because it is not clear, which methodology of biomass measurements can be used, a tool test (methodology assessment) has been included in the study. Five different methodologies have been choosen for comparison:
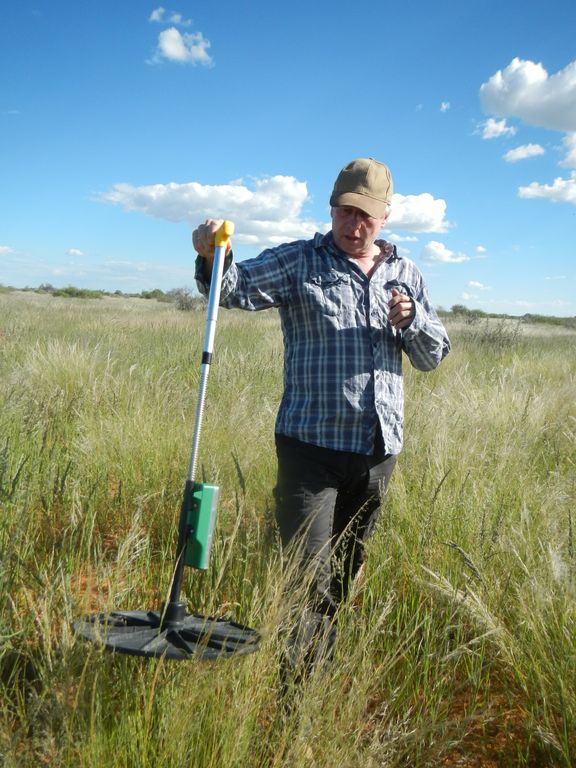
Platemeter test: Transect walk with a platemeter on all treatment and control paddocks. How and when to be done: every May from corner to the opposite (diagonal) corner (between 1 and 2 km), every 2nd step one measurement. The transect will be done every year at the same time (May) and the interannual comparison of the „average biomass hight“ will be the indication of growth and biomass.
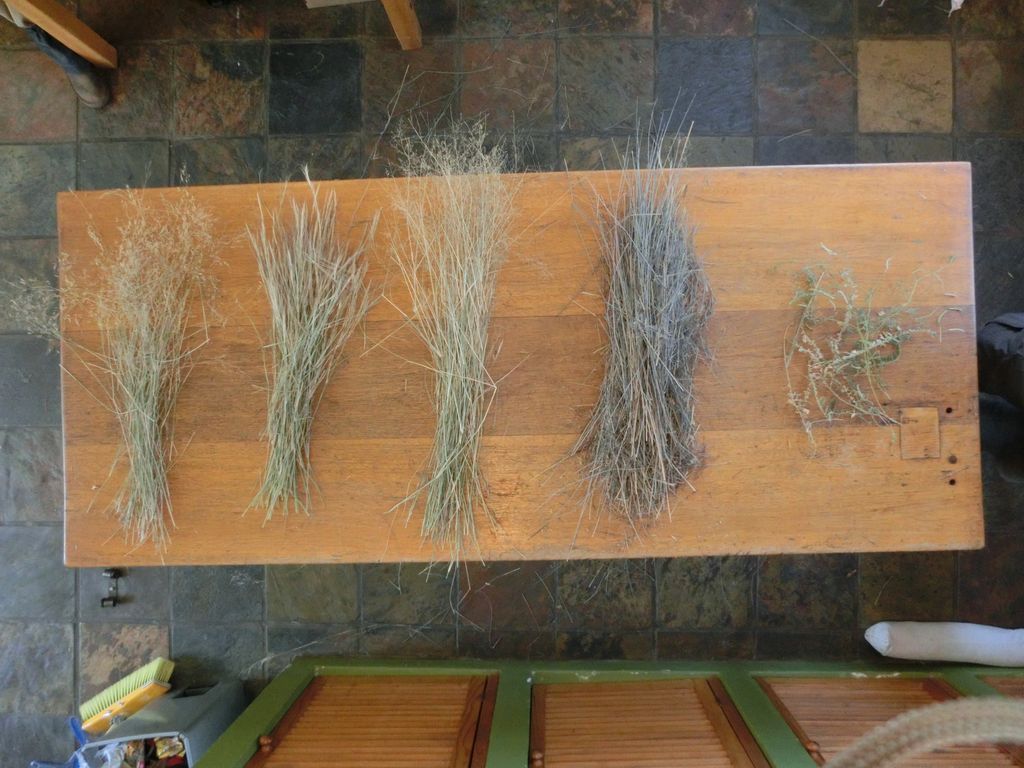
- Vegetation cut test: on 200 m randomly choosen transect, not closer than 100 m from the paddock fences or other unusual parts of the paddock. (Name der Methode und Vorgehensweise: einfügen Christian) How and when to be done: Every 20 m a 1m2 vegetation cut (10 samples per plot) will be done and can be assessed (biodiversity, biomass, feeding value). This will be done every May.
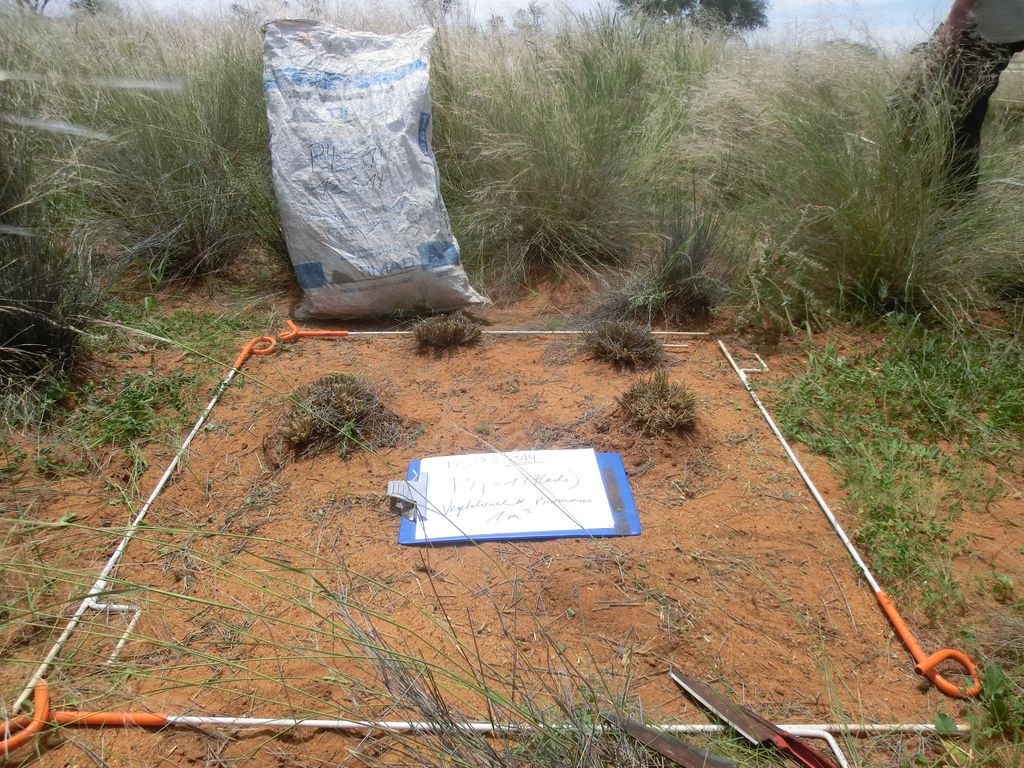
- Biomass and coverage estimation test: on a 50x50 m (2500 m2) permanently defined and marked „Estimation“-parcel (minimum 100 m apart from the paddock fence and special parts of the paddock) the methodologies of
- „Klapp“ (Biodiversity and biomass estimation combined with special values: feeding value, grazing tolerance etc) and „Braun Blanquet“ (Biodiversity and coverage of vegetation, bare land and dead material).
- How and when to be done: These methodologies will be done according to international standards of grassland estimations. The assessment will be done every May and just before and after each grazing event of the the treatment and control paddocks.
- Transect test: on a 200 m quadrat line (the borders of the parcels in test 3) qualitative biomass assessment (occurrence and abundance of plant species) will be assessed. How and when to be done: Every meter along the 200 m line the a. alive plant, b. dead plant, c. litter and d. bare soil will be assessed (what does the line touch on ground every m?). This will be done in May.
- Picture test: every year, a transect line (test 3) picture will be done. Comparison over the years. How and when to be done: Every May and before and after the grazing a picture is taken always from the main marking pole in the direction of the two adjacent marking poles (50 m distance).
The comparison of these 5 very different vegetation tests is assumed to allow answers about the best, cheapest and most usuable measure (also for farmers) to assess the vegetation coverage, biomass and grazing days estimations
Results
The meat production on Springbockvley was assessed by farm records from 1994 till 2012, the last year before converting towards organic farming and the novel grazing management system. The rainfall was uncertain and between 61 mm (1995) and 680 mm per year (2011), surprisingly with a slight increasing trend. The stocking rate and the meat production do follow the annual rainfall performance (Figure 4). The stocking rate varied between 17 (1995) and 43 kg live weight (2012) per hectare, the meat production (live weight) per hectare between 5.3 (1995) and 15.2 kg (2013).
The average number of different plant species on the different experimental grazing was assessed on 2,500 sqm plots before and after the three herds of cow herd, oxen and sheep have used the plots (Table 3).The total average number of species found in sampling plots before grazing events is higher than after grazing events. This applies to all grazing treatments, double stocking rate, high density and normal grazing respectively.
Links and Downloads
Partners:
- DITSL - Deutsches Institut für Tropische und Subtropische Landwirtschaft GmbH (Germany)
- Springbockvley (Namibia)
- Polytechnic of Namibia (PoN)
Thünen-Contact
Prof. Dr. agr. habil. Gerold Rahmann
Duration
12.2013 - 12.2017
More Information
Project status:
finished
Publications
- 0
Ludwig L, Isele J, Rahmann G, Idel A, Hülsebusch C (2019) A pilot study into biomass yield and composition under increased stocking rates and increased stocking densities on a Namibian organic beef cattle and sheep farm. Organic Agric 9(3):249–261, DOI:10.1007/s13165-018-0214-1